Here at InsideTracker, we are all about goals: setting lofty ones for ourselves, our products, our platform, and most importantly, helping you reach yours. To that end, our science team recently spent countless hours pouring over the latest scientific research and data to update our Optimal Zones. After all, to help you push past your limits, we have to push ours.
While we admit this entry is a bit longer than the norm, for the science geeks in the crowd (hi friends), it’s chock-full of interesting information and insights into the background of our platform.
The “Normal” Reference Range
The reference interval is the most popular medical decision-making tool that doctors use on a regular basis. However, you might be surprised to know that clinicians and laboratory scientists alike are discouraged from referring to it as the “normal range.”
In fact, this had been the case since the 1970s, since the terms “normal” is somewhat ambiguous and can be assumed to mean different things, depending on the audience.1
To most people, everything outside the “normal” range would imply abnormal in some way, and everything inside the range assumed to be healthy or harmless.
In reality, the reference range is what it implies – a range of values generated as a guide for the clinician to refer to when assessing where the patient falls compared to people who are supposed to be similar.
But, as a recent article in the Journal of American Medical Association pointed out, the current reference intervals are only as good as the sample of patients that were used to derive them, and even some of the more conventional biomarkers could use a little TLC in terms of making the reference intervals applicable to any one individual.2
The authors make a case for working toward more precise and personalized reference ranges via leveraging big data and even a person’s genetics.
Here at InsideTracker, we have wholeheartedly embraced these concepts as the core of what we do by creating a more personalized reference range for each person, the optimal zone, based on demographics such as your age, ethnicity, activity, and gender.
But, to better appreciate this precision approach to generating your optimal zones, it’s useful to know where the conventional reference ranges (that you might see on your lab test results from your doctor’s office) originate..
The “How” of the Reference Range: not as rigorous as one would hope…
The reference range, when applied to the individual, is only as good as the population that was used to establish the “healthy” interval.
While there is not a single authoritative source that would specify the approach required to establish health-associated reference values, the closest thing that laboratories have as a guide is the Clinical and Laboratory Standards Institute (CLSI) document C28-A2.3-8
Based on guidance from the CLSI, the best practice is to establish reference intervals recommends a sample size of at least 120 healthy individuals.
This allows one to determine where 95% of these healthy individuals’ blood values might fall (the rest being outliers).
There are at least two practical challenges around this recommendation, however.
First, where does one find 120 selfless and “healthy” individuals who are willing to undergo phlebotomy for the sole purpose of establishing a reference range? As you might imagine, this is not so trivial in practice for various reasons, including ethical considerations when it comes to originating pediatric reference intervals.
Also, this guideline applies to each partition of the reference interval, meaning that if there is a physiological reason to establish separate ranges based on gender, age, or race, one would need to find 120 healthy subjects for each group.
In practice, labs have relatively easy access to pathological samples but rarely to samples from apparently healthy subjects. Thus it is not atypical for labs to use samples from patients not suffering from significant illness that might affect the particular biomarker in question, but in this case you might imagine that capturing undiagnosed diseases of some sort into the reference range is a genuine possibility, particularly in cases where the biomarker is somewhat exploratory and/or its interaction with other biomarkers is unknown.5
More common still is the practice of merely adopting (perhaps with a quick in-house validation study) a decades-old reference range from the instrument manufacturer or using a much smaller sample of around 20 individuals, often assuming a normal (Gaussian) distribution without visually reviewing the data. The latter range is established based on the misconception that 95% of values symmetrically fall within the mean ± twostandard deviations.10-11
While it’s beyond the scope of this blog to thoroughly review all the pitfalls of the current approaches, we can, in short, say that the way that most of the currently available reference intervals were derived is far from perfect, chiefly because of the practical challenges of selection of healthy subjects, insufficient sample sizes, lack of sufficient medical examination of the donors, failure to assess other lifestyle-based factors that influence the biomarker in question, and inappropriate statistical assumptions.

What this means to you
One of the main criticisms of conventional, insufficiently stratified reference ranges is that most biomarkers exhibit less within-individual variation than between-individual variation.3,6,7,12
This means that an individual’s actual healthy range for a particular biomarker falls within a much tighter window than the population reference range. This could say that if Mary’s iron levels fall below what’s a typical historical healthy level for her, she will still be within the conventional reference range and her result will not be flagged as the potential beginning stages of iron deficiency.
Thus, although the main purpose of the clinical reference range is to detect disease, since it’s typically based on an unrepresentative population it is actually not a very sensitive tool for that purpose, let alone a way to help optimize your personal health.
Perhaps, it’s no surprise that experienced clinicians often use personal “rules of thumb” when making health management decisions based on blood data, always using individuals’ health history for context.
Reference range personalization
The most direct way to help detect meaningful biomarker changes on an individual level is to derive a personalized reference range to begin with, using the individual’s history of blood data to establish the lower and upper limits during a healthy state.
This way, Mary will be compared to a reference range obtained from her health history (perhaps with some adjustments for age).
To summarize, although likely developed with the best of intentions, the conventional reference ranges in use today are, for the most part, outdated and designed for monitoring surviving rather than thriving. We at InsideTracker believe that thriving should be everyone’s goal, and keeping track of your health objectively via blood work is a key part of this endeavor. This is why we establish personalized optimal zones for each marker based on what we know about you. And why we continue to update your optimal zones to generate the most individualized lifestyle and nutritional recommendations possible based on continually emerging sound peer-reviewed science!

2018 InsideTracker Optimal Zone updates
On this note, you’ll notice some changes when you log into your account, where some of your previously optimal blood results may no longer be so (and vice versa, depending on the which biomarker).
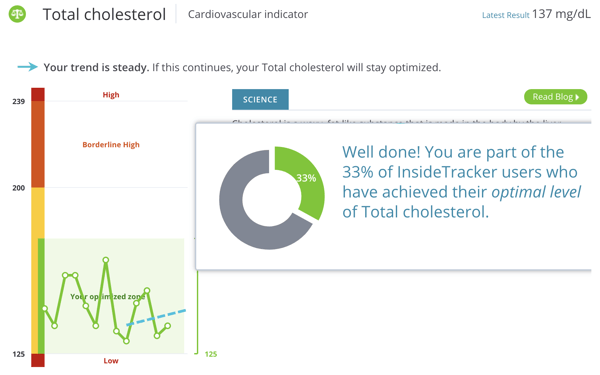
This is because, after several months of reviewing the latest peer-reviewed research as well as tapping into large blood work databases of healthy individuals like the NHANES, we decided that it was time to update the optimal zones for LDL, HDL, total cholesterol, triglycerides, hsCRP, potassium, sodium, and SHBG.
We used a combination of factors to help tease out the healthy population out of the tens of thousands of individuals that went into deriving the latest personalized optimal zones. It was multi-pronged, fairly comprehensive, and based almost entirely on peer-reviewed literature.
In fact, we let the latest research guide us where to set the upper and lower optimal zone limits, basing these on published biomarker levels that associated with increased longevity, disease prevention (as opposed to detection of severe clinical disease), athletic performance and/or BMI, as well as the potential of favorable biomarker-biomarker interactions.
To demonstrate, let’s take a high-level look at some of what we considered when arriving at the high-sensitivity C-reactive protein (hs-CRP) update.
Produced in the liver, CRP is a marker of nonspecific systemic inflammation, in part because of its sensitivity. While it’s most well known for its predictive relationship with regards to heart disease, elevated levels are also observed in metabolic dysregulation including insulin resistance and obesity, among other conditions and dysbiosis.13-14
As part of the acute phase response, levels of this protein rise as a result of tissue damage, infection, and many forms of inflammation (chronic or acute), and its dynamic range can span 10,000-fold within hours. Remarkably, though, healthy people in the general population tend to have stable average concentrations, barring some subclinical infections, inflammation, or trauma.13
The key concept here is individual, as it turns out that the conventional reference range does not apply to all genders and ethnicities as some tend to have different hsCRP level set-points. This means that a level that may be optimal for Mary, a Caucasian female who is on birth control, may actually be indicative of chronic low-grade inflammation for Aaron, who is an Asian male.15-17
In this case, you can see how a conventional reference range without consideration of gender, ethnicity, and medication use might generate significant confusion and missed opportunities for potentially very helpful lifestyle recommendations for Aaron, who might not feel all that great and knows he has room for more exercise (which has been shown to reduce CRP levels) and healthier, non-inflammatory food choices.
In all, the adjustments that were made to the eight biomarkers were largely due to recently published research that accounted for differences among genders, ethnicities, ages, medication use, and activity levels. Because you input your demographic information as part of your user profile, your optimal zones have been adjusted appropriately to make sure your goal range is as personalized as possible.
Stay tuned for more updates! The beauty of science is that it is always changing and becoming more precise. As the science of how genetic variants may impact our blood biomarkers matures, you can expect even more individualized optimal zones that, combined with your personal blood test history, may demonstrate the potential for the most precise health recommendations yet!

Get an inner edge by training based on your biomarkers. We've created this FREE e-Book to help you understand how!

Some other blog posts we think you'll love:
References:
- [1] Ceriotti, F., Hinzmann, R. & Panteghini, M. Reference intervals: the way forward. Ann Clin Biochem46,8–17 (2009).
- [2] Manrai, A. K., Patel, C. J. & Ioannidis, J. P. A. In the Era of Precision Medicine and Big Data, Who Is Normal? JAMA319,1981 (2018).
- [3] Sikaris, K. A. Physiology and its importance for reference intervals. Clin. Biochem. Rev.35,3–14 (2014).
- [4] 2. Ceriotti, F., Hinzmann, R. & Panteghini, M. Reference intervals: the way forward. Ann Clin Biochem46,8–17 (2009).
- [5] Katayev, A., Balciza, C. & Seccombe, D. W. Establishing reference intervals for clinical laboratory test results: Is there a better way? Am. J. Clin. Pathol.133,180–186 (2010).
- [6] Sikaris, K. Application of the stockholm hierarchy to defining the quality of reference intervals and clinical decision limits. Clin. Biochem. Rev.33,141–148 (2012).
- [7] Ceriotti, F. Prerequisites for use of common reference intervals. Clin. Biochem. Rev.28,115–21 (2007).
- [8] Pathology, C., Vincent, S., St, V. & Medicine, F. Reference Intervals. 29,1–5 (2010).
- [9] Katayev, A., Balciza, C. & Seccombe, D. W. Establishing reference intervals for clinical laboratory test results: Is there a better way? Am. J. Clin. Pathol.133,180–186 (2010).
- [10] Horn, P. S. & Pesce, A. J. Reference intervals: An update. Clin. Chim. Acta334,5–23 (2003).
- [11] Wachtei, M., Paulson, R. & Plese, C. Creation and Verification of Reference Intervals. 26,(1995).
- [12] Sikaris, K. A. Physiology and its importance for reference intervals. Clin. Biochem. Rev.35,3–14 (2014).
- [13] Pepys, M. B. & Hirschfield, G. M. C-reactive protein: a critical update. J. Clin. Invest.111,1805–12 (2003).
- [14] Singh, R. K. et al.Influence of diet on the gut microbiome and implications for human health. J. Transl. Med.15,73 (2017).
- [15] Cauci, S. et al.Effects of third-generation oral contraceptives on high-sensitivity C-reactive protein and homocysteine in young women. Obstet. Gynecol.111,857–64 (2008).
- [16] Divani, A. A., Luo, X., Datta, Y. H., Flaherty, J. D. & Panoskaltsis-Mortari, A. Effect of oral and vaginal hormonal contraceptives on inflammatory blood biomarkers. Mediators Inflamm.2015,379501 (2015).
- [18] Saito, I., Maruyama, K., & Eguchi, E. C-reactive protein and cardiovascular disease in East asians: a systematic review. Clinical Medicine Insights: Cardiology, 8, CMC-S17066 (2014).