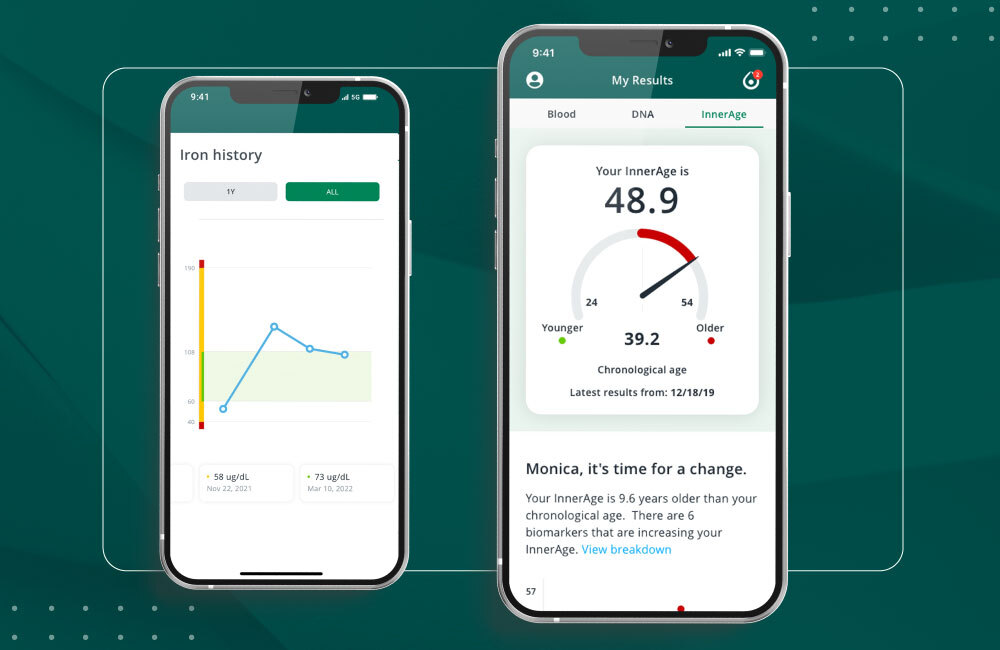
When you select an InsideTracker blood plan and add on InnerAge 2.0, you’ll notice that you see your biomarkers plotted in two key ways. First, each blood biomarker will be plotted against your personalized biomarker optimal zone. Secondly, certain blood biomarker levels will be reported in the context of your body’s biological age or InnerAge 2.0.
This article explores the following:
- Explains the differences in criteria between how blood biomarkers are plotted via personalized biomarker optimal zones versus how specific biomarker levels contribute to your body’s InnerAge 2.0.
- Shows how a biomarker can add years, or subtract years, from your total InnerAge 2.0 score, regardless of whether or not it’s in your personalized optimal zone on your blood results page based on the different sets of criteria.
- Determines actionable next steps if this is the case for you: Creating your InsideTracker Action Plan to improve unoptimized biomarkers and your InnerAge 2.0.
What are InsideTracker optimal zones?
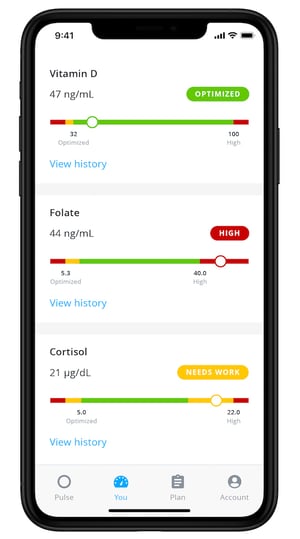
Blood test results are often displayed against a reference range. When you receive your blood results from InsideTracker, each biomarker level is plotted on a chart with corresponding zones. Here is a breakdown of what each zone means:
- At-risk zone (red): Levels that fall outside of the clinically normal reference range—say they’re too high or too low—and are best addressed with a healthcare provider.
- Normal zone (yellow): The zone labeled in yellow is referred to as the clinically normal zone, or the zone in which a doctor would consider them normal or not of concern, based on general population data. The normal zone does not account for what's optimal for you based on your unique inputs.
- Optimal zone (green): InsideTracker takes this a step further by creating personalized biomarker optimal zones—or the target range that is more relevant and personalized to you based on your age, sex, level of activity, and other factors. Personalized biomarker optimal zones are a target that InsideTracker customers typically aim to achieve.
How are InsideTracker's optimal zones determined?
InsideTracker’s scientists methodically and thoughtfully created personalized biomarker optimal zones. First, InsideTracker’s scientists reviewed data from peer-reviewed scientific papers and evaluated biomarker values from healthy individuals in large databases. From there, they determined personalized optimal zones within the clinically normal reference range that are more targeted based on age, sex, level of activity, and other factors.
InsideTracker’s analysis provides science-backed recommendations for biomarker levels that fall outside of one’s personalized biomarker optimal zone. In fact, your specific biomarker level in relation to your optimal zone is a key contributor to the recommendations in your Action Plan. So, if your biomarker levels aren’t in the optimal range, and if applicable, based on the latest science and Health Profile data, you’ll receive recommendations that are backed by scientific literature to help you achieve your personalized biomarker optimal zone.
What is InsideTracker's InnerAge 2.0?
InsideTracker’s InnerAge 2.0 is a biological age score that determines how old your body is on the inside. This biological age score is compared to your chronological age, the date on your driver's license. Knowing your body’s InnerAge 2.0 can be a powerful catalyst for change that can ultimately improve your health and longevity. InsideTracker’s InnerAge 2.0 leverages blood biomarker analysis. Blood biomarker testing is one of the most well-studied and scientifically validated health evaluation tools. And the extensive use of blood biomarker testing in healthcare and scientific research provides robust data linking blood biomarkers to health outcomes.
How was InsideTracker's InnerAge 2.0 algorithm calculated?
When the InsideTracker science and data science teams created the InnerAge 2.0 algorithm, they based it on a method described in a peer-reviewed paper by Klemera & Doubal in combination with InsideTracker’s own blood biomarker dataset.
Each of the biomarkers that InsideTracker measures was plotted independently, stratified by men and women, and evaluated against chronological age. Data scientists aimed to answer the key question, “Does this specific biomarker level increase or decrease with advancing age in men or women?” For example, “Do 70-year-old women tend to have increased or decreased levels of LDL cholesterol compared to 20-year-old women?” This question was asked of each blood biomarker in InsideTracker’s data set and for each biological sex. If the answer was, “Yes, 70-year-old women do tend to have LDL cholesterol levels that differ from 20-year-old women,” then the biomarker was included in InnerAge 2.0 for that sex.
And, if biomarker levels appear to very strongly and consistently increase or decrease with advancing age in InsideTracker’s population, then that specific biomarker contributes a greater weight to your overall InnerAge 2.0 than a biomarker that only moderately increases or decreases with advancing age in our population.
Example of how a biomarker is selected for InsideTracker's InnerAge 2.0 algorithm
The method by which a biomarker came to be included in the InsideTracker’s InnerAge 2.0 algorithm can be confusing and best understood via examples.
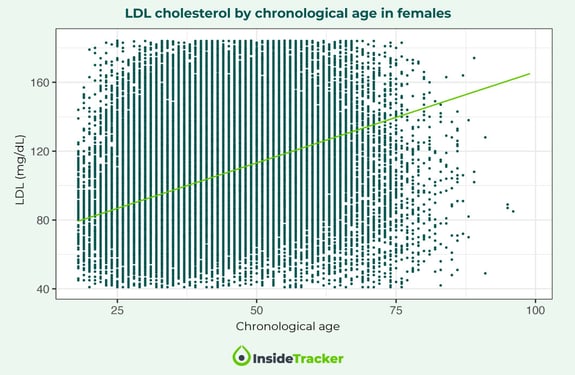
The graph above shows the LDL cholesterol values of InsideTracker customers that reported their biological sex as female, plotted by chronological age. Each dot on the graph represents a unique individual. The line that cuts right through the middle of the cloud of dots is known as the “line of best fit.” Here are three potential interpretations of the line of best fit:
- No correlation: If there is no correlation, the line of best will be horizontal, meaning that there is little to no correlation between LDL cholesterol and age in the dataset.
- Negative correlation: If there is a negative correlation, the line of best fit will trend downwards, meaning that lower LDL cholesterol levels were observed at an older age in the dataset.
- Positive correlation: If there is a positive correlation, the line of best fit will trend upwards, meaning that higher LDL cholesterol levels were observed at an older age in the dataset.
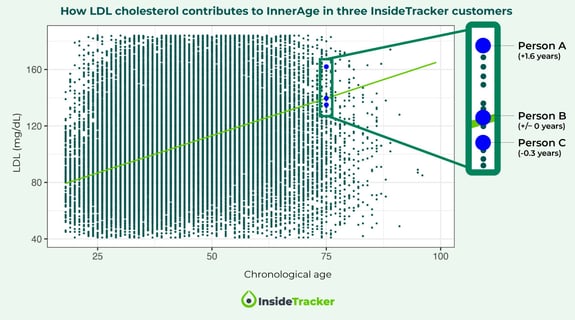
If a statistically significant positive or negative correlation was detected between a biomarker level and chronological age, the biomarker was included in the InnerAge 2.0 algorithm for that sex. In the current iteration of InnerAge 2.0, this includes 17 biomarkers for males and 13 biomarkers for females. While measuring more biomarkers increases the precision and stability of the calculation, both genders get equitable strength and accuracy from their respective panels.
In this example, the line of best fit shows a positive slope, meaning LDL cholesterol is positively correlated with age in the dataset, earning its spot in the InnerAge 2.0 algorithm for females. The takeaway from this graph is that older females tended to have higher LDL cholesterol levels than younger females. So, if your latest blood value for LDL cholesterol is below the line of best fit, then it will subtract years from your total InnerAge 2.0 score. And if your biomarker value is on the line, it neither adds or subtracts years to your InnerAge 2.0.
The number or amount of years that LDL cholesterol levels add or subtract from your InnerAge 2.0 score is based on the contribution of this biomarker to your total score in the algorithm and your specific biomarker level on your latest blood test.
Can a biomarker be optimized yet still be shown to increase InnerAge 2.0?
Because there are two different sets of criteria that determine your blood biomarker optimal zones and how blood biomarkers contribute to your InnerAge 2.0, there may be instances by which your results may tell you two different things.
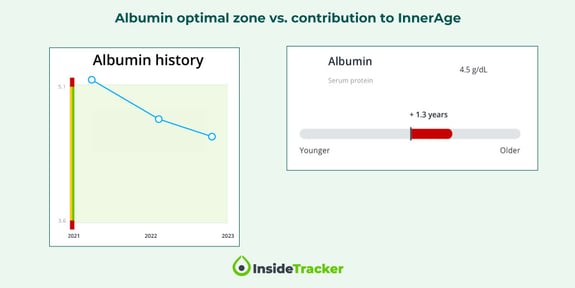
For example, your albumin levels may be in your personalized optimal zone, but they may add years to your total InnerAge 2.0 score. If albumin is adding years to your InnerAge 2.0 but is in the optimal zone, you won’t see recommendations to improve or change it, and that’s OK! The best course of action is to prioritize improving other markers associated with your InnerAge 2.0 that do have scientifically-based recommendations to improve them—for example, LDL cholesterol or blood glucose.
It’s important to note that you won’t receive recommendations to improve optimized biomarkers. For example, you won’t see recommendations to improve an optimal albumin level (even if it’s adding years to your InnerAge 2.0). It’s important to note that you will only see recommendations that apply to you based on your blood results, Action Plan, Health Profile, and the latest applicable scientific research.
How can you improve biomarker levels and your InnerAge 2.0?
You can set up your InsideTracker Action Plan to improve unoptimized biomarkers and your InnerAge 2.0. Select the goal that is most relevant to the area of health you want to focus on improving like Heart Health, Stress, Sleep, Overall Health, and even InnerAge 2.0. If you want to lower your InnerAge 2.0, select that goal and it will prioritize recommendations to improve relevant biomarkers contributing to your InnerAge 2.0.
Resources:
[1] https://www.merriam-webster.com/dictionary/chronological%20age