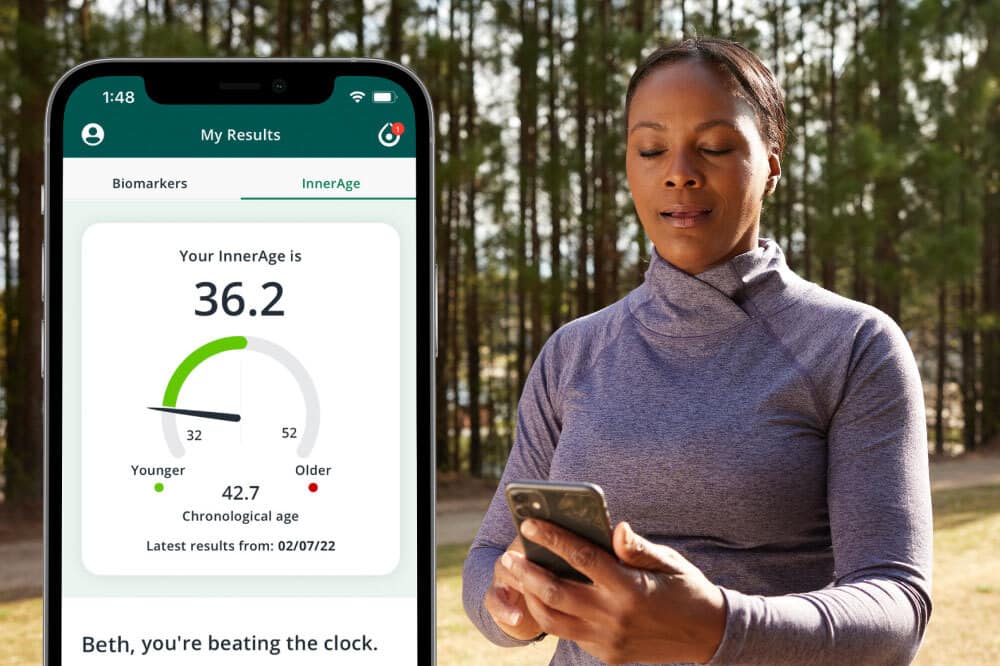
 InsideTracker’s InnerAge first launched in 2015 and has since been a powerful motivator to take control of your health and wellness. InnerAge calculates your biological age—or how old you are internally—based on key biomarkers and allows you to gain a comprehensive understanding of how your blood biomarkers add to or subtract years from your chronological age. But as data evolves, the InnerAge model has had to evolve with it. Enter InnerAge 2.0, an improved algorithm that compares each of your key biomarkers to your peers, weighting and calculating the contribution of each one to your biological age.

InnerAge 2.0 uses blood biomarkers to determine your biological age
Biomarkers refer to substances found in the blood like proteins, cells, hormones, nutrients, and enzymes that are measured via a blood test. Vitamin D, blood sugar (glucose), and cholesterol are all blood biomarkers. Blood biomarkers are affected by lifestyle factors including sleep patterns, stress levels, food choices, exercise, and recovery from exercise. For example,
- The amount of leafy green vegetables you eat can impact glucose levels
- Sleeping can impact low-density lipoprotein (LDL) cholesterol levels
- Resistance training impacts inflammation or hsCRP levels
Each biomarker has a designated reference, or normal range, and values that fall outside of that range—either above or below it—may be indicative of a health concern.
But some blood biomarkers also correlate with aging and healthspan, as some biomarker levels tend to trend up or decline as you get older. Based on scientific research and InsideTracker’s internal customer database, InsideTracker data scientists identified a group of biomarkers most correlated with aging that feeds into the InnerAge 2.0 algorithm.
Your biomarker levels then individually add or subtract years to your chronological age depending on how far they deviate from the aging trend line to estimate your biological age.
What blood biomarkers does InnerAge 2.0 measure?
The biomarkers that correlate with aging differ between biological sex. So the InnerAge 2.0 calculation analyzes 17 biomarkers for males and 13 biomarkers for females, but both calculations are being held to equal scientific standards. And as the data evolve, so may the inputs to the InnerAge algorithm.
Below is a breakdown of the key biomarkers and how they impact your biological age.
When these biomarkers are higher, they tend to increase InnerAge
When the words elevated, higher, or increased are used to describe how biomarkers add to your InnerAge, it indicates that the biomarker levels from your latest blood draw are higher than what's expected based on your chronological age.
Glucose: Optimal fasting glucose levels indicate your body is functioning properly to process glucose and use it as fuel. Glucose tolerance decreases as you age, resulting in elevated blood glucose. High levels of fasting blood glucose in addition to high levels of HbA1c are the best measurement to assess insulin sensitivity or insulin resistance. Therefore, aging is correlated with increases in fasting glucose. [1]
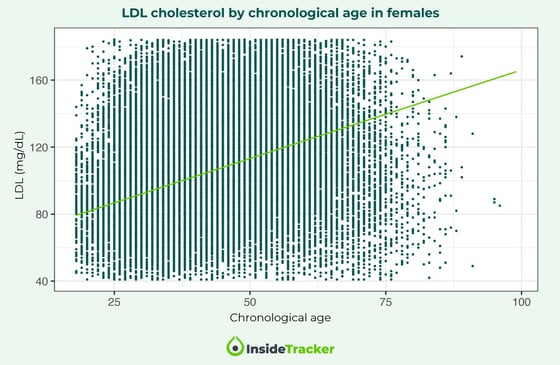
Low-density lipoprotein (LDL): LDL is often known as “bad” cholesterol because if elevated for extended periods, it can form plaque in your blood vessels, leading them to narrow and constrict blood flow. Data shows that LDL tends to increase with age, meaning higher LDL is associated with older age. [2]
Triglycerides: Triglycerides are the primary form of fat in foods and the body. Levels of triglycerides in the blood can indicate an excessive amount of available energy or may signify an issue with the liver since triglycerides are produced in the liver. Research has also found that higher triglyceride levels are associated with an increased likelihood of developing age-related diseases, so higher levels can increase your InnerAge. [3]
Hemoglobin A1c (HbA1c): This measure represents the average blood glucose levels over the previous 90-120 days. Glucose binds to hemoglobin as it builds up in the blood, so the higher the glucose in your bloodstream, the higher your HbA1c. High HbA1c levels may indicate insulin is not functioning properly, leading to a risk for diabetes. Both well-established research and customer data show that glucose tends to increase with age, leading to a higher HbA1c, and increased risk for diseases such as diabetes. [4]
GGT: GGT is a liver enzyme and indicator of liver health. GGT also plays an essential role in how the liver breaks down toxins. Above optimized GGT levels may indicate disease or damage to the liver, resulting in fatigue, loss of appetite, nausea, and weight loss. GGT tends to increase with age, and elevated GGT levels can increase your InnerAge. [5]
Basophils: Basophils are a type of white blood cell that act as infection fighters in the immune system and are typically activated during an allergy response, but levels are otherwise low. Optimized basophil levels indicate reduced inflammation and better overall health. InsideTracker data found that basophil percent is highly correlated with age, meaning a higher basophil percent is associated with older age. [6]
Red cell distribution width (RDW) (females only): RDW measures the variation in the size of your red blood cells. A low RDW indicates your red blood cells are similar, whereas a high RDW indicates variations in red blood cell size. Healthy red blood cells are all similar in size, and InsideTracker data found that RDW is correlated with age in women. RDW tends to increase with age, which means a higher RDW level is associated with older age. [7]
Monocyte percent (females only): Monocytes are a type of large white blood cell and play an important role in chronic inflammation, stress, and infection. A high monocyte percentage can indicate that the immune system is fighting foreign pathogens in your body. Optimized levels of monocytes are associated with improved overall wellness, indicating proper immune function, which can shave years off your InnerAge. [8]
Eosinophil percent (females only): Eosinophils are a type of white blood cell that fights infection, and are usually elevated during an allergy response or in chronic inflammation. InsideTracker data found that eosinophil percent is correlated with age, meaning a higher eosinophil percent is associated with older age, and optimal levels are indicative of reduced inflammation and better overall health. [9]
SHBG (males only): Sex hormone-binding globulin or SHBG is a protein that binds to and transports sex hormones, particularly testosterone. High levels of SHBG reduce the amount of free, active testosterone available, so optimizing SHBG can increase the availability of sex hormones. This can benefit bone health, sexual function, and heart health and keep InnerAge lower.
High-sensitivity C reactive protein (hsCRP) (males only): hsCRP is a circulating protein that is a good indicator of general inflammation. Age-related increases in inflammatory markers in males, including hsCRP, are well documented by research, and this increase is commonly called “inflammaging,” meaning a higher hsCRP is linked to aging more quickly. Lower hsCRP is associated with better heart health, lower blood pressure, and improved blood sugar control. [10]
Neutrophils (males only): Neutrophils are the most abundant type of white blood cell and the first to be activated during an immune response. Optimized neutrophils are associated with overall health and a positive immune response, and a higher neutrophil percent is highly associated with older age. [11]
Mean corpuscular hemoglobin (MCH) (males only): This is the average amount of hemoglobin in a red blood cell. High MCH levels can lead to tiredness, brain fog, and confusion or memory loss. MCH tends to increase with age in men, meaning a higher MCH level is associated with older age. [12]
Mean corpuscular hemoglobin concentration (MCHC) (males only): MCHC is the average concentration of hemoglobin found in red blood cells and it helps deliver oxygen throughout the body. High levels of MCHC can cause fatigue, weakness, weight loss, or abdominal pain. MCHC tends to increase with age, which means a higher MCHC level may add years to your InnerAge age. [12]
When these biomarkers are lower, they tend to increase InnerAge
When your levels of these biomarkers are lower than the average for your age and sex, they may add years to your InnerAge.
Albumin: Albumin is a marker of liver function that generally peaks at age 20, then decreases. People who maintain higher albumin levels into older years tend to have greater muscle mass and lower inflammation than people with lower albumin levels. [13]
Lymphocytes (percent of WBC for men, count for women): Lymphocytes are a type of white blood cell activated in response to immune system stress. InsideTracker data shows that lymphocyte count tends to decrease with age, thus a lower level is associated with older age. [14]
Total iron-binding capacity (TIBC) (females only): TIBC is a measure of the amount of iron your blood can carry. In the bloodstream, iron is attached to the protein transferrin, which helps transport iron throughout the body and prevents iron from causing oxidative damage. Our data indicate that TIBC is inversely correlated with age in women. TIBC tends to decrease with age, which means a lower TIBC is associated with older age, and vice versa. [15]
DHEAS (females only): Well-established research, including InsideTracker's database, illustrates that DHEAS decreases with age. Maintaining higher levels of DHEAS is protective against age-related diseases because of its anti-clotting and anti-proliferative properties. [16]
Calcium (males only): Calcium is necessary for cellular reactions and is one of the most important factors for maintaining bone health throughout aging. Blood (serum) calcium levels are very well regulated, so if serum levels drop, calcium is pulled from the bones to bring levels back to normal. Calcium levels tend to decrease with age, so having a healthy level of serum calcium is important to maintain bone health. [17]
Free testosterone (males only): Free testosterone is the active testosterone available for your body to use. An optimal amount of free testosterone is important for muscle building and strength and preventing age-related bone loss, therefore suboptimal levels of free testosterone contribute to a higher InnerAge. [18]
Red blood cell count (RBC) (males only): RBC count is the total number of red blood cells in one microliter of blood. RBCs transport oxygen throughout the body, and as a component of your iron group, RBC count contributes to your current iron status. InsideTracker data indicate that RBC count is inversely associated with age in men, so a lower RBC count can increase your InnerAge. [19]
Hematocrit (HCT) (males only): HCT is the percentage of red blood cells in circulation in the bloodstream, indicating how much oxygen the blood can transport to tissues throughout the body. Receiving appropriate amounts of oxygen is critical for muscle and tissue health. InsideTracker data shows that HCT tends to decrease with age, so a lower HCT level can add years to your InnerAge.
Incorporate data from an InsideTracker DNA test for even more insights
Blood biomarker levels provide an objective look at your body’s internal condition at a given time while your DNA remains constant. Your genetic code can provide insights into your genetic potential for certain risks related to longevity, categorizing your risk of unoptimized blood biomarkers as either reduced risk, average risk, or elevated risk. Given this information, you can prioritize your lifestyle habits to either work with or against genetic predispositions, allowing you to reach your goals more effectively.
How can you use your InnerAge 2.0 to improve your health?
If you complete an InnerAge blood draw or add an InnerAge calculation onto an Ultimate plan, you can select InnerAge as the goal of your Action Plan. Depending on your biomarker levels, current habits, and the latest available science, InsideTracker's proprietary algorithm prioritizes recommendations for nutrition, exercise, supplement, and lifestyle habits that will most benefit your InnerAge.
For example, if your LDL results come back high, and you currently only eat fruit three times per week, your Action Plan might include a recommendation to eat at least one serving of high-fiber fruit per day. That’s because research shows eating more servings of fruit each day over several years is associated with a longer life and reduced risk of age-related diseases. [21] Included with the recommendation will be the specific benefits of eating more fruit, which fruits count towards the daily serving and some ideas from a registered dietitian on how to incorporate this recommendation seamlessly into your daily habits.
References:
[1] https://www.ahajournals.org/doi/10.1161/CIRCRESAHA.118.312806
[2] https://www.eatright.org/health/essential-nutrients/fats/what-is-cholesterol
[3] https://www.ncbi.nlm.nih.gov/pmc/articles/PMC7397742/
[4] https://pubmed.ncbi.nlm.nih.gov/24698119/
[6] https://journals.lww.com/nursingcriticalcare/fulltext/2019/07000/basophil_count.5.aspx
[7] https://www.ncbi.nlm.nih.gov/pmc/articles/PMC3915449/
[8] https://pubmed.ncbi.nlm.nih.gov/31027108/
[10] https://pubmed.ncbi.nlm.nih.gov/15258556/
[11] https://www.ncbi.nlm.nih.gov/books/NBK570571/#article-126216.s9
[12] https://www.ncbi.nlm.nih.gov/pmc/articles/PMC3915449/
[13] https://aspenjournals.onlinelibrary.wiley.com/doi/10.1002/jpen.1451
[14] https://www.nhlbi.nih.gov/health/lymphopenia?msclkid=113ee162aabe11eca0ea9bd5d18abdc7
[15] https://www.ncbi.nlm.nih.gov/pmc/articles/PMC5198508/
[16] https://pubmed.ncbi.nlm.nih.gov/10595831/
[17] https://link.springer.com/article/10.1023/A:1021272831251
[18] https://pubmed.ncbi.nlm.nih.gov/18270261/
[19] https://www.ncbi.nlm.nih.gov/pmc/articles/PMC3915449/
[20] https://www.ncbi.nlm.nih.gov/books/NBK542276/
[21] https://pubmed.ncbi.nlm.nih.gov/33641343/